Page 1 of 1
SpectrumAnalyzer Saturation feature explanation?
Posted: Wed Jul 24, 2024 12:33 am
by ben.arcadia
Hi, just wondering if anyone has resources/an explanation of how the saturation feature on the SpectrumAnalyzer software works? We have been getting good raman signal of salicylic acid (yay!) with our solid cuvette attachment and want to further improve our signal to noise.
I've watched the OpenRAMAN Solid Powder Add-on youtube video and tried to tune the mirror positions to get a signal similar to that in the video, but I think I am missing what exactly these lines represent and what we are optimizing for during this step.
If anyone has an explanation of this, that would be super helpful, thanks!
-Ben
Re: SpectrumAnalyzer Saturation feature explanation?
Posted: Wed Jul 24, 2024 10:58 am
by Luc
I can give a brief explanation for a better understanding

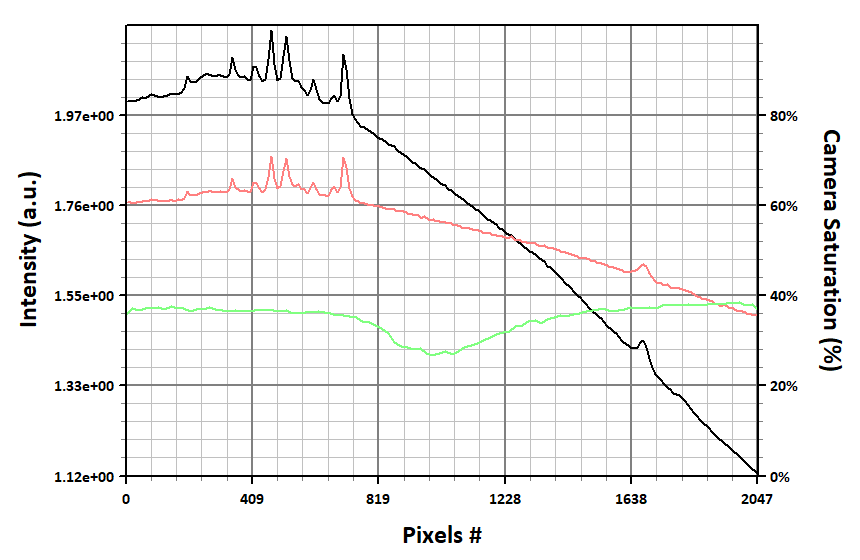
The laser spot is re-imaged on the slit which clips the width (but not height) of the spot. This clipped spot is re-imaged again on the camera after horizontal dispersion by the grating.
The spectrum, in black, is obtained by summing the colums of the image.
In red, you see the maximum of each column. You should maximize this value to get the best signal-to-noise ratio but without saturating the sensor (touching the 100%). The sensor loose linearity above 80% saturation so I usually aim for the ~80% line.
In green you see the sum of each row this time. For a clean spot, you'll get a bell shape. The idea is to center the bell shape in the field of view and to eventually decrease the roi size to remove the excess tails. Tails add camera noise but no signal so it's better to avoid them. But a small ROI makes it more difficult to catch the signal in the first place. You can use the upper knob to center the signal in the FOV.
You can also read my latest post on camera performances evaluation for a good grasp of camera noise models
Re: SpectrumAnalyzer Saturation feature explanation?
Posted: Sat Jul 27, 2024 12:25 am
by ben.arcadia
Hi Luc, thanks for your response, I have just a few clarifying questions.
1) What is the axis/direction for the green curve? If the green curve is the sum of the rows and we want the bell shape in the center where our ROI is, wouldn't we expect the bell to be curved in the other direction? I guess I'm not sure if the 'camera saturation axis' is being used for both red and green lines.
2) What exactly is a clean spot and what is effecting the shape of the green curves width and height? Is it dependent on how much we are filling the 50uM slit?
Thanks again for your response!
-Ben
Re: SpectrumAnalyzer Saturation feature explanation?
Posted: Sat Jul 27, 2024 6:35 am
by Luc
The axis are remapped such that the full plot x axis correspond to the image's vertical axis. I can swap in the v2.0 of the software (développement not started yet...). I could also add a mode to display directly the image of the camera.
The cleanliness of the spot is usually good with the cuvette and looks like on your image. With the solid cuvette it tends to be broader (maybe due to subsurface scattering).
I worked on an update of the liquid cuvette, I have to post about it on the website. I'm on medical rest at the moment and can't work so it'll wait a bit :-/
Re: SpectrumAnalyzer Saturation feature explanation?
Posted: Wed Jul 31, 2024 4:49 pm
by ben.arcadia
Hi Luc, thanks again for your response, I hope you are recovering well!
I've attached one of the better spectra of salicylic acid we have been able to get, this is with baseline removal off, exposure set at 1122ms, gain set at 28, and num avg set at 10.
How critical would you say tuning the saturation is to getting an accurate spectra? We have observed that our black spectra line can take the exact same shape while the red and green curves fluctuate between replicates. I ask because our goal is to read a number of different biological samples (mostly microorganisms) and compare their spectra. Do you think tuning the saturation perfectly for each sample will be necessary?
I think those software upgrades sound extremely useful! Is it possible to do pixel binning to further increase signal to noise?
Thanks for all your help
Best,
Ben
- baseline removal is turned off
- 2024-07-29_salicylicacidsaturation_1122_28_10.png (31.48 KiB) Viewed 364119 times
Re: SpectrumAnalyzer Saturation feature explanation?
Posted: Wed Jul 31, 2024 5:43 pm
by Luc
You don't need to fine tune the exposure for similar samples
the scale of the black curve also automatically compensate for different exposure time and gain also.
From the raw signal, it looks like you have a lot of offset. This is usually found when you have light leakage into the spectrometer or when your sample exhibit fluorescence. There's little you can do about fluorescence but for light leakage dimming the ambient light is the easiest option.